Jaroslava Panisova1 and Roman Pašteka2
1 Geophysical Institute, Slovak Academy of Sciences, Bratislava, Slovakia,
This email address is being protected from spambots. You need JavaScript enabled to view it.
2 Department of Applied and Environmental Geophysics, Comenius University, Bratislava, Slovakia
Microgravimetry
The microgravity method is based on a highly accurate measurement and interpretation of very small variations in Earth's gravitational field. Measured gravity values are influenced by variations in the Earth's tides, latitude, elevation and surrounding topography. Only anomalous part of measured acceleration due to gravity is interpreted, so called Bouguer anomalies are created, where the effects of all these non-geological factors are removed. The methodology of microgravimetry has been described in detail in [1, 5].
Building correction
When microgravity surveys are carried out inside or in close vicinity to large buildings, their presence causes a lowering of measured gravity field. The term "building correction" covers all additional corrections, by which the effects of buildings and known underground spaces are removed [1, 4]. The standard approach to their calculation is based on an approximation of the walls by a set of simple geometric bodies (rectangular prisms or 3D vertical prisms with polygonal cross-section). In the new approach, the model of surveyed building is reconstructed from photographs in software PhotoModeler. Output is 3D polyhedral body in chosen coordinate system [4].
Program Polygrav
The gravitational effect of homogeneous polyhedron described by a triangular irregular network (TIN) is calculated in in-house program Polygrav as the summation of the integrations along the line elements of its individual triangles using equation derived by [3]. The output file from PhotoModeler in "raw" format serves as direct input to our program. This file contains the spatial coordinates of all points and surface triangles that form the exported body. The topology of the model is created and controlled by the user. Program Polygrav checks and reports the following events: 1) the existence of multiple identical triangles, 2) an incorrect order of the vertices in some side and 3) missing triangles. Bodies of different densities need to be calculated separately.
Example
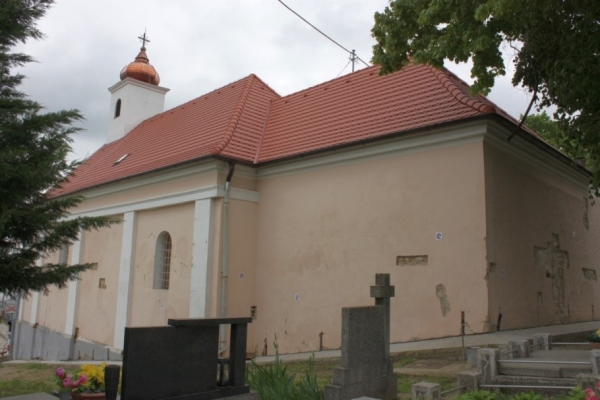
The late Romanesque Church of Virgin St. Mary's Birth is located in Horné Krškany village near Nitra in western Slovakia. The church was built in the second half of the 13th century. Later reconstructions reflect elements of Gothic and Baroque styles. In the year 2008, valuable gothic fresco painting from 14th century was found in the sanctuary during restoration works. A geophysical survey of this church [4] was carried out within the framework of the International Course on ArchaeoGeophysics INCA 2009 for students of geophysics and archaeology [6].
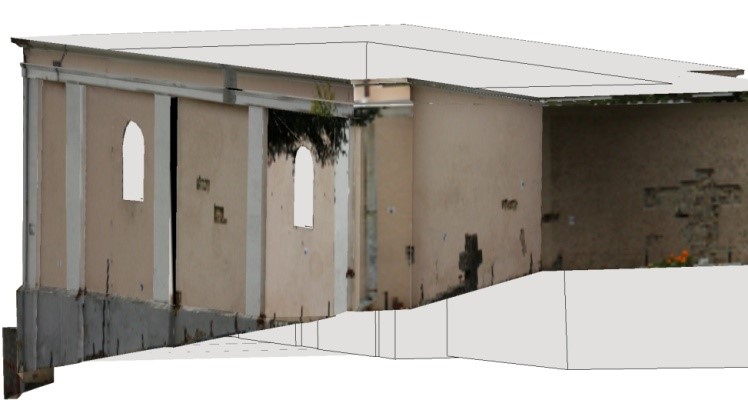

Fig. 1: Two different views of the digital model in PhotoModeler software.
Photogrammetric processing
In 2010, this church was recorded using convergent photogrammetry for spatial building reconstruction purposes. A Canon EOS 450D digital camera, calibrated in the test and a calibration field [2] was used for image acquisition. The model of the church was located in a geodetic coordinate system using 37 control points marked with coded targets. It was necessary to measure 90 additional points for the reconstruction of the building interior because it was obscured by church furniture. A total model accuracy of 6.5 cm (an empirical mean error) was achieved. In Fig. 1 left, a spatial digital model of the church without a roof with original textures from PhotoModeler software is displayed. Fig. 1 right represents the 3D wire frame view of a selected part from the final church model. For clarity, we just show a partial view where the red lines represent a triangulation of several selected surfaces only. The final model of the church (Fig. 1) consists of 939 points and 1902 triangles.
Table 1: Input parameters used in synthetic modelling.
|
Parameters of model |
Lower estimate |
Reference model |
Upper estimate |
|
Thickness of walls [m] |
0.85 |
1.00 |
1.15 |
|
Height of walls [m] |
9.90 |
10.0 |
10.1 |
|
Density [g/cm3] |
1.70 |
1.80 |
1.90 |
Accuracy of building correction
The accuracy of the building correction depends on the spatial accuracy of the model and the accuracy of the density estimate. Changing the parameters of the synthetic models (see Table 1), the accuracy of the building correction normalized on a reference model (plan view in Fig. 2a) was determined. The maximum uncertainty on the building correction, estimated from synthetic modelling, is ±7 μGal. To a distance of ≈1.0 m from the walls (1.5 m in the case of the building corners), only the anomalies of detected features greater than 7 μGal are identifiable. As the repeatability of microgravity measurements is less than 4 μGal, the spatial accuracy of models from PhotoModeler needs to be improved to the error threshold of 1–2 cm. An accuracy analysis of the calculated building correction is not possible with the standard approach.
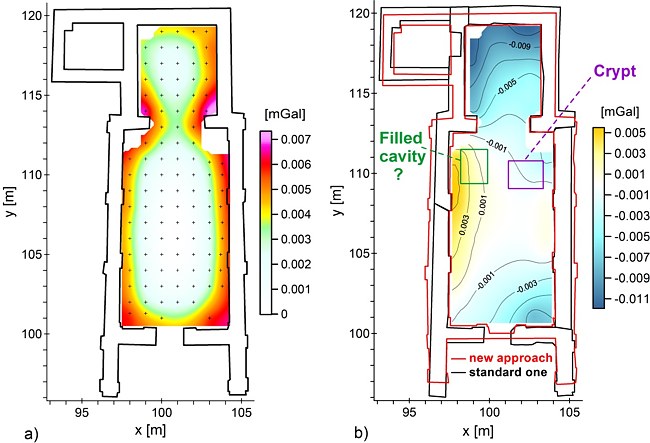
Fig. 2: a) The uncertainty on the building correction estimated from synthetic modelling of the church walls. b) The comparison of two ground plans displayed along with the building corrections difference map: new polyhedral model versus old prismatic model.
Comparison of approaches
The ground plans of two models of the church obtained by different approaches in two independent programs are compared in Fig. 2b. In the standard approach the main walls of the building were approximated using five vertical prisms with a polygonal cross-section and an estimated density of 1.8 g/cm3 in Potent software (Geophysical Software Solutions). The "standard approach" ground plan shown by a black line fits well with the "new approach" ground plan (red line) in the interior parts of the church but the exterior walls differ in shape causing a maximum difference of 30–40 cm in wall thickness.
The new method of the building effect calculation allowed high lancet windows and a broken arch to be included in the model (Fig. 1 right). This was not possible in the vertical prism approximation. Differences in the range of +5 μGal to –11 μGal between the building corrections calculated from the PhotoModeler output file and prismatic model (Potent software) arose primarily from shape discrepancy (map in Fig. 2b). From an interpretation point of view, only the filled cavity is influenced by these differences.
Conclusions
Our new method provides for high accuracy of calculated building effects, thus improving the ability of the microgravity technique to detect cavities situated in close vicinity to man-made structures. Such an improvement can contribute to a more precise construction of Bouguer anomaly maps and their interpretation. Moreover, the reconstruction of spatial models of historical buildings using close-range photogrammetry represents a valuable contribution to the recording of cultural heritage sites.
References
- 1. Blížkovský M. 1979. Processing and applications in microgravity surveys. Geophysical Prospecting 27(4): 848–861.
- 2. Fraštia M. 2005. Possibilities of using inexpensive digital cameras in applications of close-range photogrammetry. Slovak Journal of Civil Engineering 8(2): 20–28.
- 3. Götze HJ, Lahmeyer B. 1988. Application of three-dimensional interactive modeling in gravity and magnetic. Geophysics 53(8): 1096–1108.
- 4. Panisova J, Pašteka R, Papčo J, Fraštia M. 2012. The calculation of building corrections in microgravity surveys using close range photogrammetry. Near Surface Geophysics 10(5): 391–399. DOI: 10.3997/1873-0604.2012034.
- 5. Pašteka R, Pašiaková M, Panisova J, Zahorec P, Papčo J, Fraštia M, Wunderlich T, Terray M. 2013. Microgravity method in archaeological prospection: methodical comments on selected case studies from Slovakia. SEG Technical Program Expanded Abstracts 2013: 1966–1971. DOI: 10.1190/segam2013-0299.1
6. Rabbel W, Serif B, Pašteka R. 2010. The INCA International Course on ArchaeoGeophysics – an EU intensive program of teaching interdisciplinarity in science. EGU General Assembly 2010, Vienna, Austria, Geophysical Research Abstracts 12, 14041.
 pdf version to download