Method
The integrated numerical modelling is based on 2D joint interpretation of thermal data, topography, geoid and gravity data to determine lithosperic thermal structure in the study area. The program used consists of a 2-D finite element algorithm to calculate the temperature distribution based on a user-defined lithospheric structure where each body is characterized by its density, thermal conductivity and heat production. The body structure is as much as possible constrained by existing seismic and geological data. Based on the calculated temperature field, densities are calculated, taking into account the dependence of density on temperature through the coefficient of thermal expansion. Then, the isostatic topography, gravity anomalies and geoid undulations are calculated.
Geophysical data
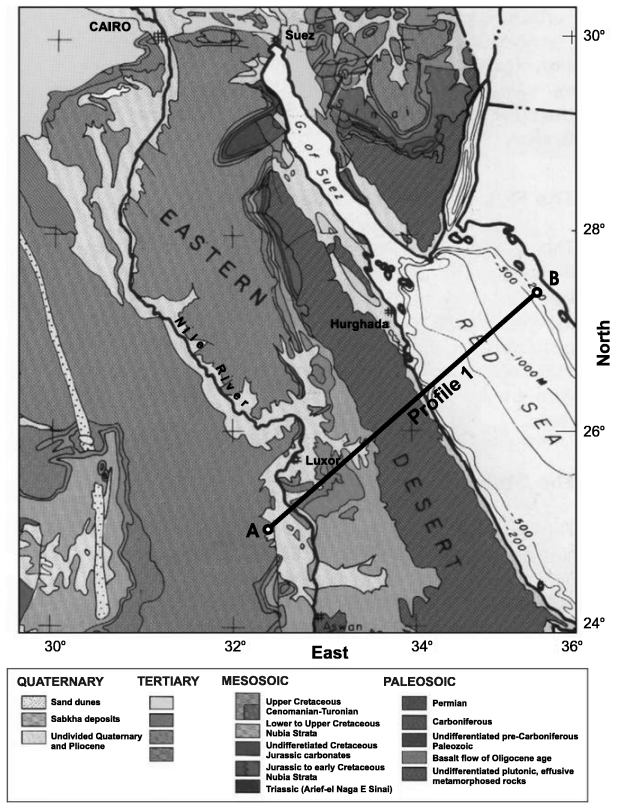
Topography (Fig. 2a) has been taken from the GTOPO30 database, the free air gravity anomalies (Fig. 2b) from the TOPEX 1-min gravity data set (ftp://topex.ucsd.edu/pub), geoid data (Fig. 3a) from the EGM96 global model, the surface heat flow density data (Fig. 3b) were compiled from the worldwide data set of Pollack et al. (1993) and from the data published by Šafanda et al. (1995) (white dots). Moho depths were taken from Geological and geophysical information system for Eurasia, the Middle East and North Africa, digital database development for the Middle East and North Africa (http://www.geo.cornell.edu/geology/me_na/report/report.html).
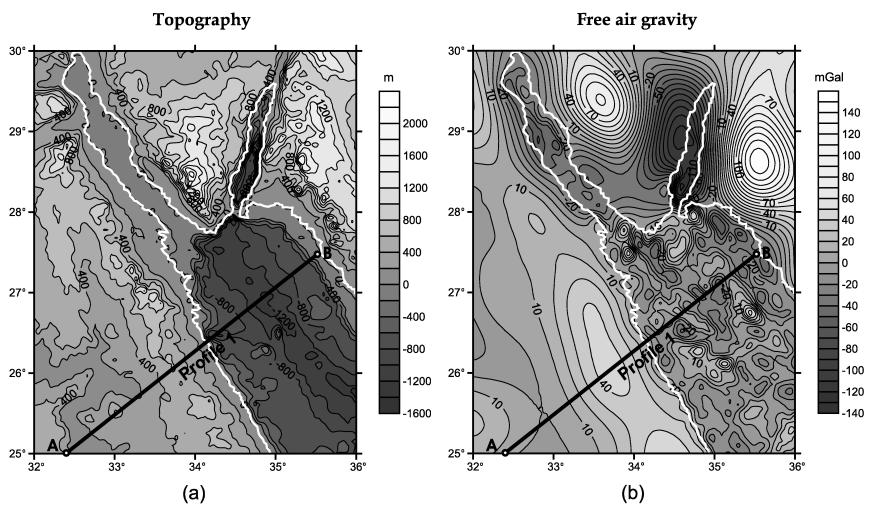
Fig. 2. (a) Topography of the Red Sea region (from GTOPO30 data set). (b) Smoothed free-air gravity anomaly map of the Red Sea region (from TOPEX gravity data, 1 min. grid, ftp://topex.ucsd.edu/pub).
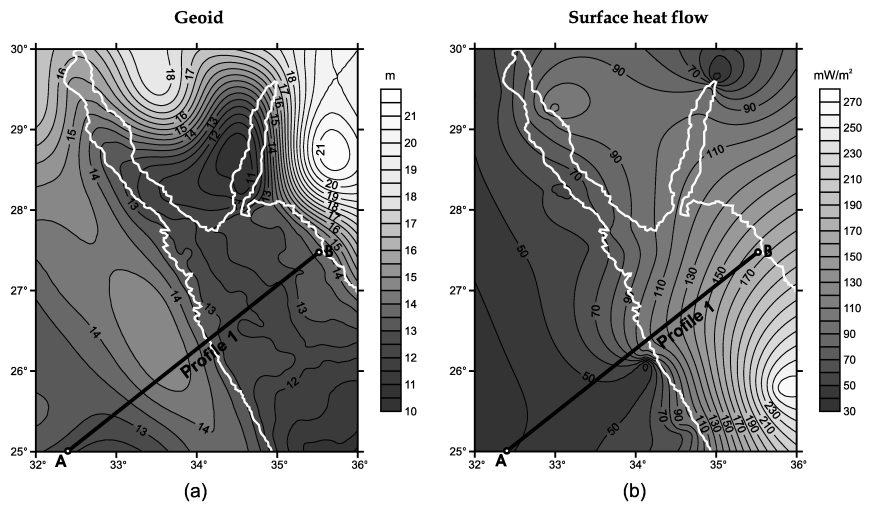
Fig. 3. (a) Geoid anomaly map of the Red Sea region (from TOPEX geoid data, 2 min. grid, ftp://topex.ucsd.edu/pub). (b) Map of the surface heat flow density of the Red Sea region (from Pollack et al., 1993).
The initial model was compiled after 3D gravity model calculated by IGMAS by Saleh et al. (2006). The thermal and density-related parameters were then modified by method of trial-and-error until a reasonable fit was obtained between data and model predictions. Densities and thermal properties of the different bodies used in the resultant model of Profile 1 (Fig. 4) are illustrated in the Table 1.
Table 1. Densities and thermal properties of the different bodies used in the resultant model of Profile 1.
|
Nr. |
Unit |
HP |
TC |
r0 |
|
1 |
Quaternary and Pliocene sediments |
3.0 |
2.5 |
2220 |
|
2 |
Tertiary sediments |
3.0 |
2.5 |
2400 |
|
3, 4 |
Upper crust (basement rocks) |
2.0 |
2.0 |
2750 |
|
6 |
Igneous crust |
0.2 |
2.0 |
2850 |
|
5, 7 |
Lower crust |
0.2 |
2.0 |
2900 |
|
8, 11 |
Normal upper mantle |
0.05 |
3.4 |
3250 |
|
9 |
Red Sea upper mantle |
0.05 |
3.4 |
3200 |
|
10 |
Red Sea anomalous upper mantle |
0.05 |
3.4 |
3120 |
Nr.: Reference number in Fig. 4; HP: Heat production (mW/m3); TC: Thermal conductivity (W/(m*K[JD1] )); r0: density at room temperature (kg/m3).
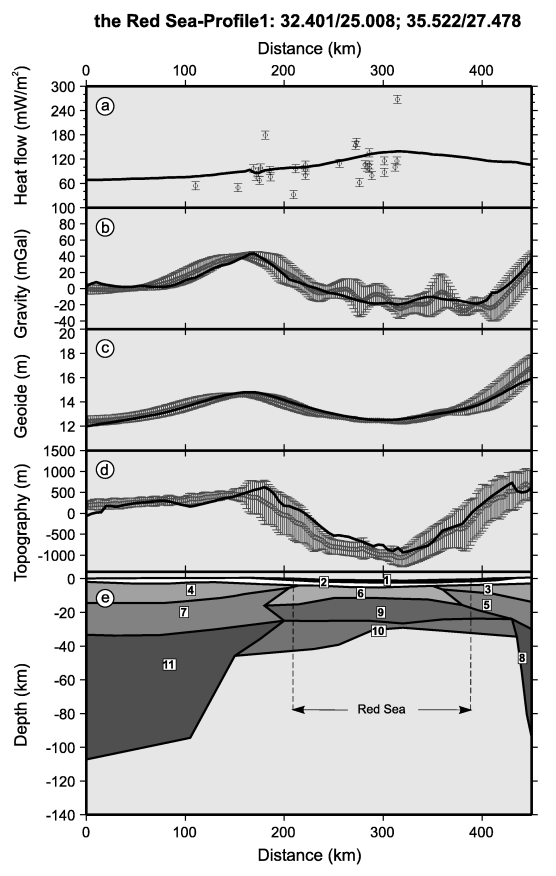
Fig. 4.Lithospheric model along Profile 1 (with exact coordinates) (a) - surface heat flow, (b) free-air gravity anomaly, (c) - geoid, (d) - topography with dots corresponding to measured data with uncertainty bars and solid lines to calculated values, (e) – lithospheric structures. Numbers within the model bodies correspond to material number in Table 1.
Density model shows clear large differences in the crustal and lithospheric thickness between continental and oceanic part of model. The oceanic crust of the Red Sea is much more thinner (12-15 km) in comparison of the continental crust which is located on both sides of the Read Sea. The continental crust located the eastern (western) from the Read Sea reaches the thickness around 28-33 km. The low density anomalous body located in the lowermost part of the upper mantle in the Red Sea area indicates the possible presence of partial melting in the upper mantle and supports the idea that a large scale asthenospheric upwelling might be responsible for the subsequent rifting of the Red Sea. The upplift of the asthenospheric mass in the Read Sea could be accompanied by the process of underplating beneath the Moho discontinuity. This result is in good agreement with results published by Makris et al. (1988), Makris and Ginzburg (1987) and Martinez and Cochran (1988).
References
- Egyptian Geological Survey, 1994: Geological map of Sinai, Arab Republic of Egypt, Scale 1:250 000.
- Pollack, H. N., S. J. Hurter, and J. R. Johnson (1993), Heat flow from the Earth’s interior: Analysis of the global data set, Rev. Geophys., 31, 267 – 280.
- Saleh, S., Jahr, T., Jentzsch, G., Saleh, A., Abou Ashour, N. M., 2006: Crustal evaluation of the northern Red Sea rift and Gulf of Suez, Egypt from geophysical data: 3-dimensional modeling. Journal of African Earth Sciences, 45, 257-278.
- Makris, J., Ginzburg, A., 1987: The afar depression: transition between continental rifting and sea-floor spreading. Tectonophysics 141, 199–214.
- Makris, J., Rihm, R., Allam, A., 1988: Some Geophysical aspects of the evolution and structure of the crust in Egypt. In: Greiling, S.E.-G.a. R.O. (Ed.), The Pan-African Belt of Northeast Africa and Adjacent Areas, Tectonic Evolution and Economic Aspects of a Late Proterozoic Orogen: Braunschweig, Friedr. Vieweg & Sohn, pp. 345–369.
- Martinez, F., Cochran, J.R., 1988: Structure and tectonics of the northern Red Sea: catching a continental margin between rifting and drifting.Tectonophysics, 150, 1–32.
[JD1]Should * be?