
Western Carpathian transect I
Transect I starts in the Bohemian Massif, crossing the orogen between the Alps and the Western Carpathian Mts. in southeastern direction, passes through the Danube Basin and ends in the Pannonian Basin (Fig. 1).
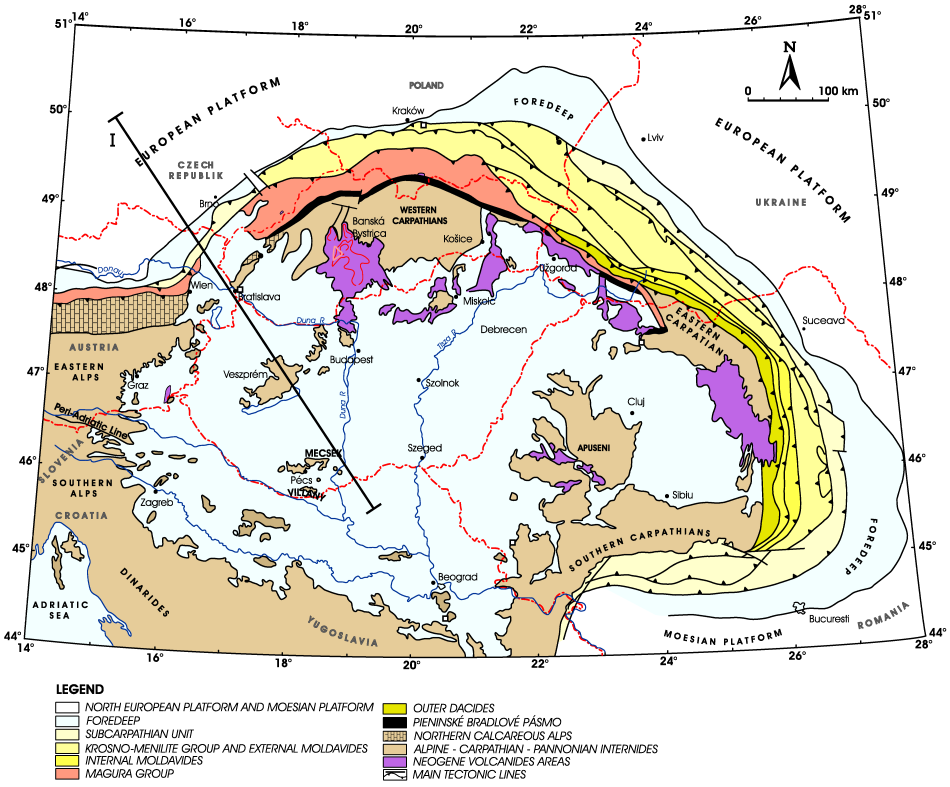
Fig. 1. Location of transect I in the Carpathian-Pannonian Basin region.
Method
Lithospheric structure along transect I (Fig. 2) has already been modelled using the 2D integrated geophysical modelling method that combines the interpretation of surface heat flow, gravity, and topography data for the determination of the lithospheric thermal structure. Detailed description of the method can be found in (Zeyen and Fernàndez, 1994). Modelling results for transect I were described in Zeyen at al. (2002). Based on the determined temperature field in the lithosphere, we can calculate the yield strength for a given distribution of rheological rock parameters. The strength is defined as the minimum of brittle and ductile strength at each point.
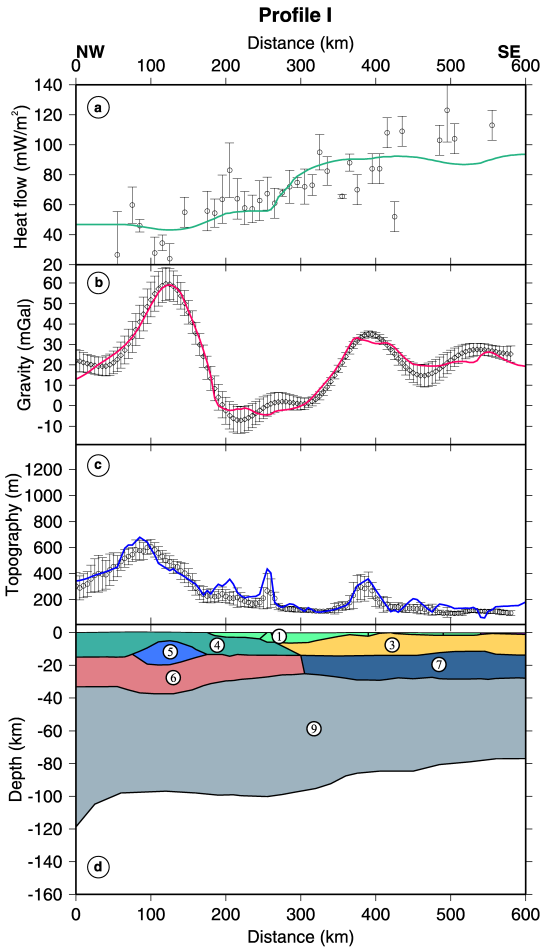
Fig. 2. Lithospheric model along Profile I: (a) Surface heatflow, (b) free air gravity anomaly, (c) topography with dots corresponding to measured data with uncertainty bars and solid lines to calculated values. Numbers in (d) correspond to material number in Table 1b (Zeyen at al. (2002)).
Results
We have calculated the temperature distribution for a given model along transect I (Fig. 3), where the lower limit of the model corresponds to the 1300 °C isotherm. The resulting temperature field is determined by the effect of the heat sources and background heat flow density from the lower mantle. The reliability of the temperature model normally depends on the accuracy and density of measurements of the surface heat flow density. Since our lithological model is controlled by the calculation of free air anomaly and topography, reliability of the model increases greatly.
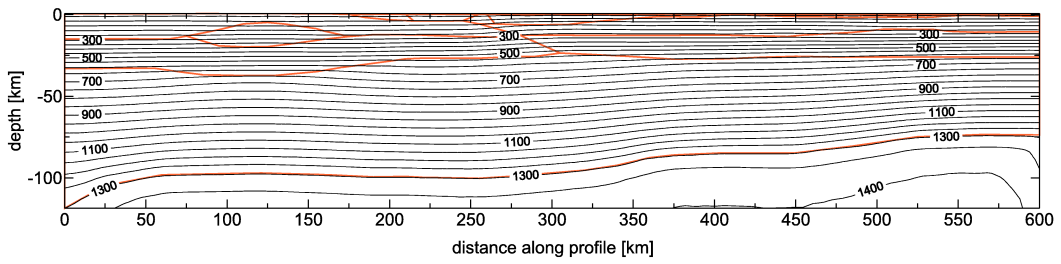
Fig. 3. Lithospheric temperature distribution for transect I. Isolines every 100 °C. The bottom of the model corresponds to the 1300 °C isotherm.
Based on the rheological parameters shown in Table 1b, we have calculated strength distribution in the lithosphere.
|
Definition |
Parameter |
Value |
|
Gravity acceleration, ms-2 |
g |
9.81 |
|
Universal gas constant, JmolK-1 |
R |
8.314 |
|
Temperature at the base of the lithosphere, °C |
Tm |
1300 |
|
Static friction coefficient |
fs |
0.6 |
|
Strain rate, s-1 |
10-15 |
|
|
Hydrostatic pore fluid factor |
λ |
0.35 |
Table 1a. General properties used for the calculation of the rheological model.
|
Nr. |
Unit |
HP |
TC |
ρ |
Ap |
n |
Ep |
|
1 |
Neogene sediments |
2.5-3.0 |
2.5 |
2400-2550 |
3.16E-26 |
3.30 |
186 |
|
3 |
Carpathian and Pannonian upper crust |
3.0-3.5 |
3.0 |
2750 |
3.16E-26 |
3.30 |
186 |
|
4 |
European upper crust |
0.5-2.0 |
2.5-3.0 |
2750-2800 |
3.16E-26 |
3.30 |
186 |
|
5 |
Anomalous upper crust (Bohemian Massif) |
1.0 |
2.0 |
2900 |
6.31E-20 |
3.05 |
276 |
|
6 |
European lower crust |
0.2 |
2.0 |
2960 |
6.31E-20 |
3.05 |
276 |
|
7 |
Carpathian and Pannonian lower crust |
0.2 |
2.0 |
3000 |
6.31E-20 |
3.05 |
276 |
|
9 |
Lower (mantle) lithosphere |
0.05 |
3.4 |
3325 |
7.94E-18 |
4.50 |
535 |
Table 1b. Thermal and rheological parameters used for modelling along transect I (after Carter and Tsenn (1987) and Goetze and Evans (1979)). HP: heat production (μWm-3), TC: thermal conductivity (Wm-1K-1), ρ: density at room temperature (kgm-3), Ap: power law pre-exponential constant, n: power law exponent, Ep: power law activation energy (kJmol-1).
Fig. 4a shows vertically integrated compressional and extensional strength along transect I. Fig. 5 and Fig. 6 show yield strength contour plot for compressional and extensional deformation along profile I. We adopted a strain rate 10-15 s-1, which is commonly observed in compressional and extensional settings (Carter and Tsenn (1987)). The strength envelopes have been calculated for both compressional and extensional regimes. Fig. 7 shows strength distribution for selected lithospheric columns in the Bohemian Massif, the Western Carpathians and the Pannonian Basin.
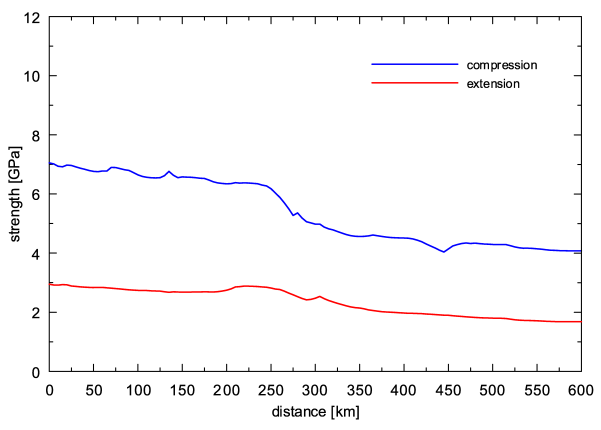
Fig. 4a.Vertically integrated compressional (blue line) and extensional (red line) strength calculated along transect I.
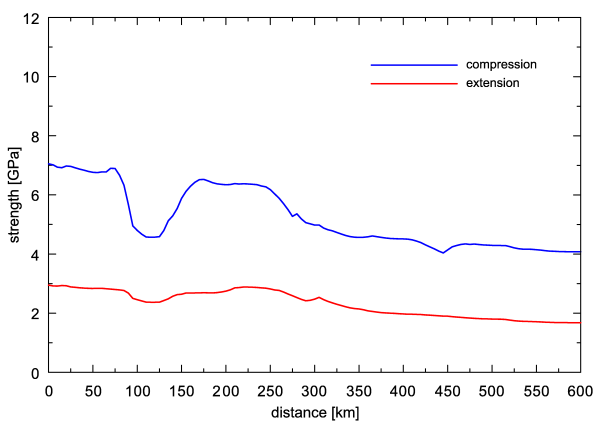
Fig. 4b.Vertically integrated compressional (blue line) and extensional (red line) strength calculated along transect I (rheological parameters for anomalous body 5 under the Bohemian Massif were considered as those of upper crust).
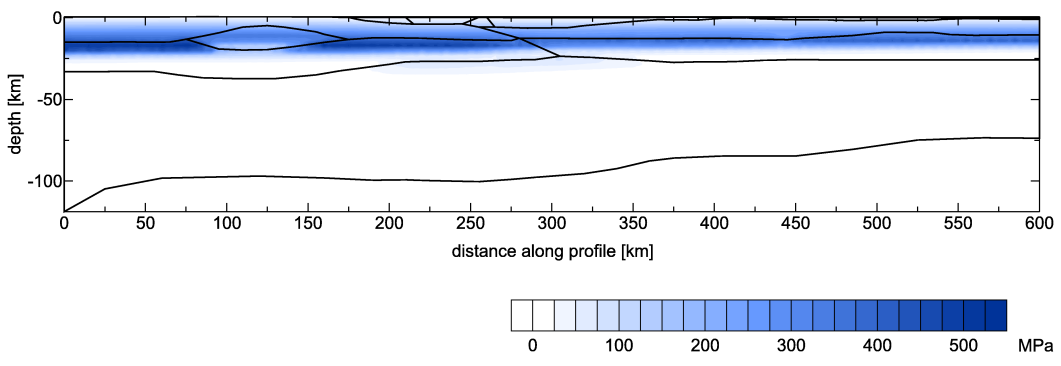
Fig. 5. Yield strength contour plot for compressional deformation calculated along transect I at a strain rate 10-15 s-1.
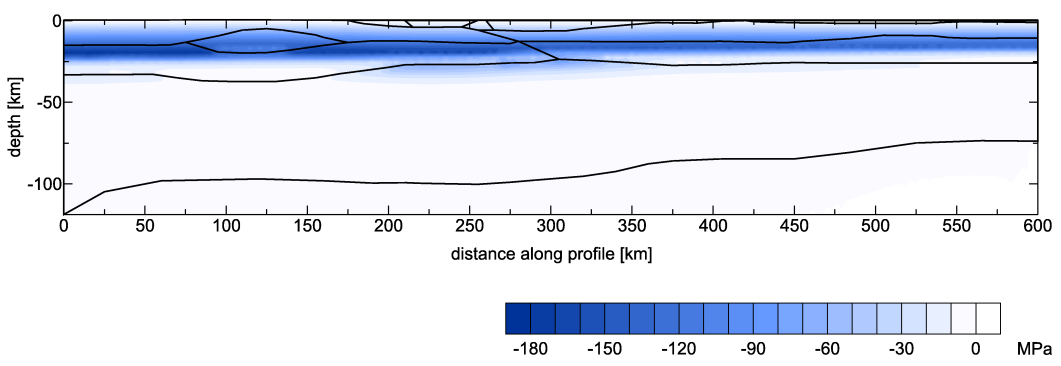
Fig. 6. Yield strength contour plot for extensional deformation calculated along transect I at a strain rate 10-15 s-1.
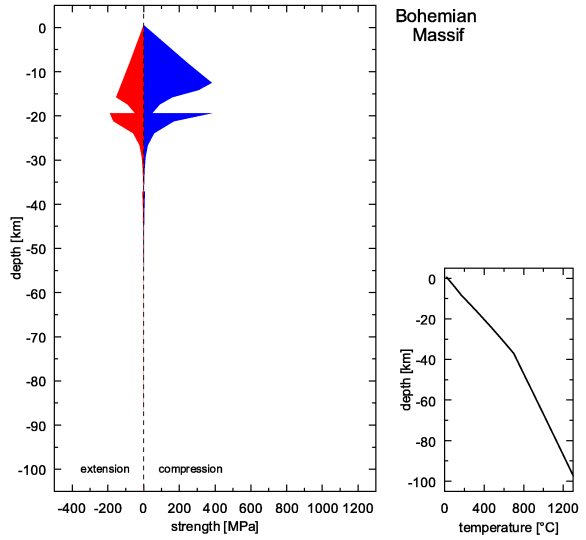
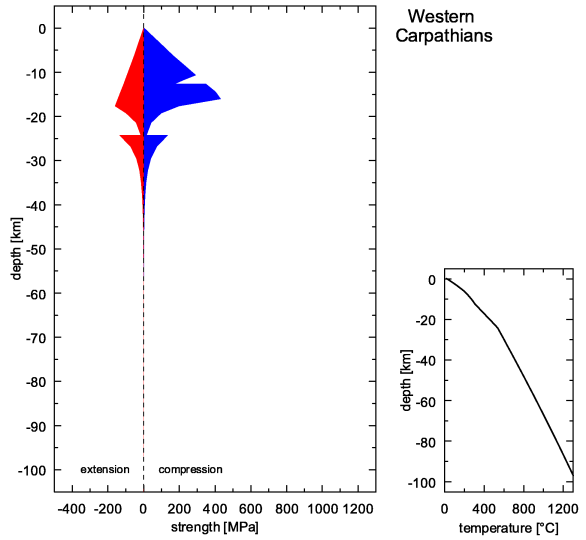
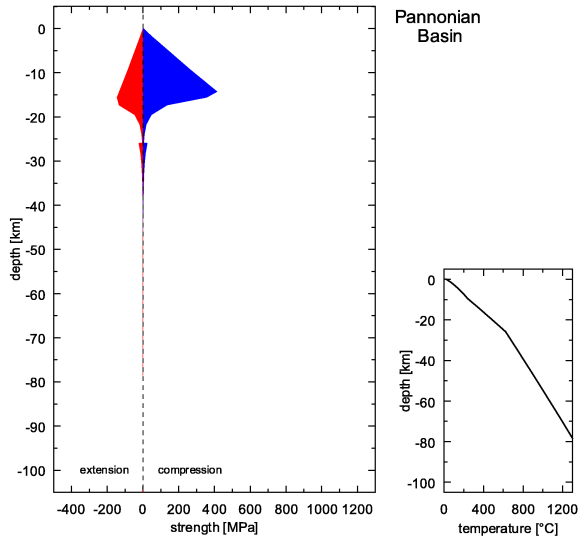
Fig. 7. Vertical strength distribution for different lithospheric columns calculated along transect I. Negative and positive values correspond to extensional and compressional strength respectively.
Based on analysis of the yield strength contour plot and vertical strength distribution for different lithospheric columns for compressional and extensional deformation calculated along transect I (Figs. 5 and 6), the largest strength can be observed within the upper crust with the maximum (400 MPa) on the boundary between the upper and lower crust. This phenomenon is typical for all studied tectonic units: the Bohemian Massif, the Western Carpathians and the Pannonian Basin. These results suggest mostly rigid deformation in the upper crust of the units. By contrast, the lower crust in the Bohemian Massif and the Western Carpathians reflects significantly lower strength, while in the Pannonian Basin the strength is the smallest. In all tectonic units the strength within the uppermost mantle (lower lithosphere) disappears. Based on this result it can be suggested that the ductile deformation dominates in this part of the lithosphere.
References
Carter, N. L., and Tsenn, M.C. 1987: Flow properties of continental lithosphere. Tectonophysics, 136, 27-63.
Goetze, C., and Evans, B. 1979: Stress and temperature in the bending lithosphere as constrained by experimental rocks mechanics. Geophys. J. R. Astron. Soc., 59, 463-478.
Zeyen, H. and Fernàndez, M., 1994: Integrated lithospheric modeling combining thermal, gravity and local isostasy analysis: application to the NE Spanish Geotransect. J. Geophys. Res., 99: 18089-18102.
Zeyen, H., Dérerová J., Bielik, M. 2002: Determination of the continental lithosphere thermal structure in the western Carpathians: Integrated modelling of surface heat flow, gravity anomalies and topography, Phys. Earth Planet. Inter., 134, 89 – 104.
Full paper can be found at: http://www.degruyter.com/view/j/congeo.2012.42.issue-4/v10126-012-0016-5/v10126-012-0016-5.xml?format=INT