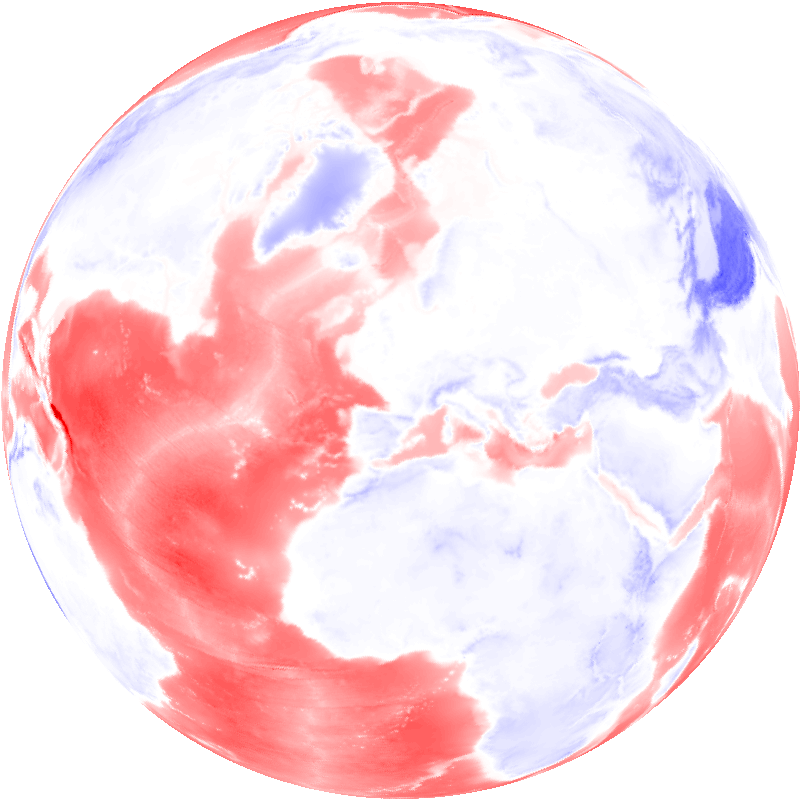
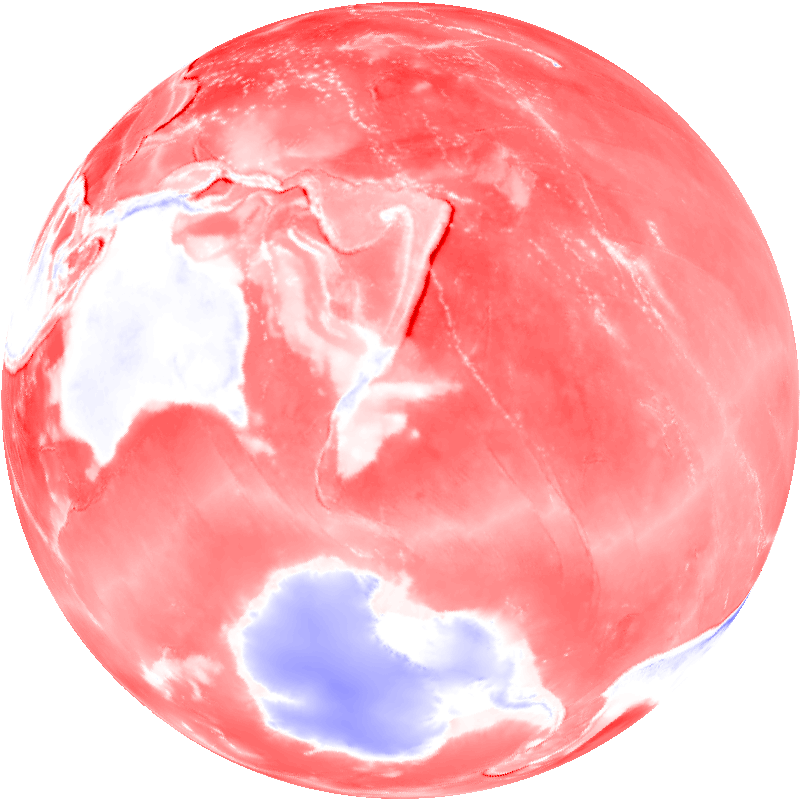
Our source of the knowledge of the magnetic field are the data from the geomagnetic observatories; these are the time sequences of values of the 3 components of the magnetic field. At each station, the local x,y,z coordinate axes are oriented towards local north, east and down directions, respectively. For the global viewing of the magnetic field we have to use the global (geocentric) coordinate axes - the x,y,z axes are oriented towards the point with 0°N latitude and 0°E longitude (intersection of the equator with the Greenwich meridian), the point with 0°N latitude and 90°E longitude and the point with 90°N latitude and 0°E longitude (the north pole), respectively.
Thus, the data from every geomagnetic observatory represent the magnetic field as a time sequence at this single point of the Earth surface. In order to obtain the values of the magnetic field at each point of the Earth surface we need to perform certain interpolation of these data. However, the problem is that there are only little more than 100 geomagnetic observatories (which produce uninterrupted time sequences of the field data) and these observatories are distributed very non-uniformly around the globe (most of them are located at higher northern or southern geographic latitudes). Therefore we used the interpolation procedure developed by the first author which works well even for very non-uniform distribution of the measured data points. Moreover, this procedure can interpolate at the arbitrary surface (this time it was
the surface of the rotational ellipsoid defined by WGS84).
In this way we obtain the values of the magnetic field over the whole surface of Earth. In order to present them in an image we need to use certain projection from the ellipsoid to the planar surface. As every such global projection distortes the geometry in some way (in other words, no global projection corresponds exactly to the view of some observer at any point of space), we used the projection which corresponds to the view of observer above some point of the Earth at the infinite distance. Of course, in this way we cannot see the whole Earth surface in a single image - it is always one half of the whole surface. The advantage is that we can easily construct many such views for the observers above any chosen points of the
Earth surface.
The procedure of obtaining the videos of the global magnetic field and its changes was the following:
(1) For each geomagnetic observatory, the local x,y,z components of the magnetic field were transformed to the global x,y,z components (as defined above).
(2) The dipole magnetic field of the Earth was subtracted from the measured data. This is necessary as the spatial and temporal changes of the field are usually much smaller than the value of the dipole field and the images would barely display any change.
(3) For each observation time the global distribution of the magnetic field (without dipole contribution) was calculated by interpolation.
(4) For any given viewing direction the planar image of the magnetic field (as seen by the distant observer) was calculated using the corresponding projection.
(5) The consecutive images obtained for some given time interval were used to create a video (by the program mencoder).
(6) In addition, to see only the time changes of the magnetic field there were created the difference images by subtracting the first image (in the time sequence) from each image in the sequence. From these transformed images the new video showing only temporal changes was created as above.
As an example we present here the videos of the geomagnetic data for July 10th, 2005. That day the geomagnetic activity was increased: expressing by means of a ten-grade scale (0 to 9), the planetary geomagnetic index Kp was as high as 6+ (i.e. a bit more than 6).
We have chosen the y-component of the global magnetic field and two viewing positions: the first one above 45°N geocentric latitude (the corresponding geographic latitude is slightly higher due to the oblatening of Earth) and 0°E geocentric (and geographic) longitude (thus above the Greenwich meridian); the second one is on the opposite point of the Earth, above -45°N geocentric latitude (thus 45°S geocentric latitude) and 180°E geocentric (and geographic) longitude. In order to know which portion of the Earth globe we see in these views, there are presented two corresponding views of the Earth topography which were created from the global database Etopo2 by the same procedure as for the magnetic field.
For each displayed quantity - the y-component of the magnetic field and the height above the sea level - red colour represents the negative values and blue colour represents the positive values; the intensity of colour represent the absolute value of the quantity. Thus for example, for the magnetic field at the Greenwich meridian, the red colour means a deviation of the magnetic needle to the west and the blue colour means the deviation to the east from the normal (mean) geomagnetic north. For the topography, red colour represents (the bottom of) the oceans and the blue colour represents the continents.
For the magnetic field we present videos displaying the non-dipole part of the field and videos displaying the temporal change of the non-dipole part of the field. In the first case the video consists of 48 images taken at time intervals of 30 minutes (duration of the video is 12 seconds), in the second case the video consists of 1440 images taken at time intervals of 1 minute (duration of the video is 48 seconds).
Links:
Non-dipole part of the y-component of geomagnetic field
northern view file
southern view file
Time change of the non-dipole part of the y-component of geomagnetic field
northern view file
southern view file
Topography


